Low bar — except NII guidance.
Thesis
Bull case
NII prints above +7.7% YoY and management raises the FY26 guide above 8% or frames 2027 NII growth positively, confirming JPM/Citi read-through. IB/trading merely match the conservative pre-announcement while the wallet (GS +21% IB fees) suggests upside risk. At ~10.7x forward earnings with estimates already cut ~2%, a guide raise likely drives a sharp re-rating toward analysts' price targets ($62-70).
Bear case
Deposit costs reprice faster than asset yields (deposit beta), forcing management to hold or trim the NII guide — the Wells Fargo template, punished even in a good rate tape. BAC screens as the capital-markets laggard (-10% IB vs GS +21%), card/commercial credit costs build amid a hawkish Fed and 5.2% 10Y pressuring its large bond book, and the five-quarter beat streak makes an in-line print a disappointment. The stock is still 17% above its 52-week low, so downside room exists.
What would change our mind
- FY26 NII guidance held at or trimmed below the 6-8% range, or management signals 2027 NII growth near zero — confirms the de-rating was fundamental
- Provisions materially above peer trends with rising card/commercial NCOs
- Q3 NII below ~+6% YoY despite the September hike — would indicate deposit-cost pressure is overwhelming asset sensitivity
- Fed pivots to cuts driven by growth/credit deterioration rather than benign disinflation
Since publication vs SPY · closed horizons are frozen
The full research everything the view rests on
Direct answer to the question asked
Where the edge would come from
What the price assumes
Consensus: Q3 EPS $1.10-$1.12 (bullish sets $1.16), revenue ~$30.6-30.9B. Sources conflict on implied YoY revenue growth — one set says ~4.7% (vs 9.8% in the prior-year quarter), another says ~9%; the bundle does not resolve this, so treat the growth-rate framing cautiously. FY26 EPS $4.56-4.57, FY27 $5.21-5.22, with estimates drifting ~2% lower over the past month. Management pre-announced IB fees down ~10% YoY, trading ~flat, and FY26 NII growth toward the upper end of 6-8%. Five straight quarterly EPS beats mean an in-line print alone is treated as a mild disappointment; the whisper bar is a clean beat plus an NII guide raise.
Why the market may be wrong
The sell-off conflated a sector-wide rate/duration shock (10Y to ~5.2%) with BAC-specific deterioration, but the September-October stress was a price-of-money shock, not a credit break (AAA spreads unchanged, AA/A/BBB widened only modestly; only CCC widened materially). Higher rates and a steeper curve are NII-positive for asset-sensitive banks like BAC, and peer prints (JPM raised NII guidance, Citi NII +13.7%, WFC provisions below consensus) suggest the fundamental backdrop is better than the 1.9-sigma monthly decline implies.
The one thing to watch
The debate about EPS beat/miss is noise — management already told you the quarter's shape; the single variable that resolves this stock is whether the FY26 NII guide goes above 8% or stays capped there, because JPM already raised and WFC already showed that an NII miss is punished even in a supportive rate tape. Watch the guide language on 2027 deposit beta, not the headline number.
Key evidence (8)
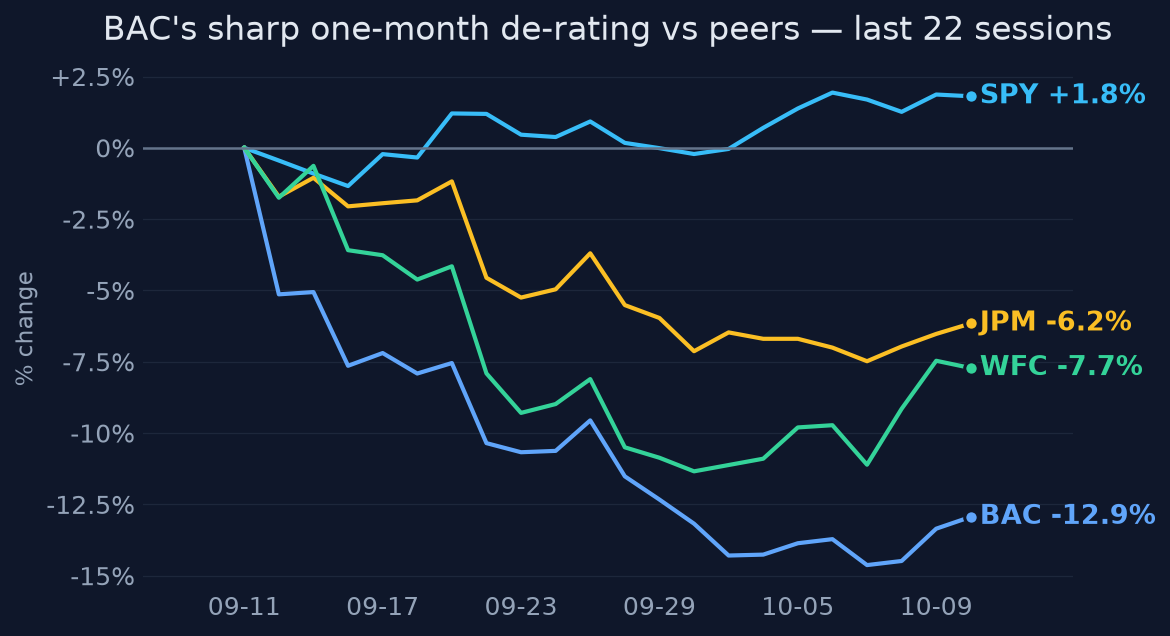
- BAC -12.9% over 1 month, a 1.9-sigma move vs own history; -15.8% below 52w high; forward P/E ~10.7-11.3x, low end of range [quant analysis, Oct 13 2026]
- Q3 consensus EPS $1.10-$1.12, revenue ~$30.6-30.9B; implied YoY revenue growth conflicting across sources (~4.7% vs ~9%); FY26 EPS $4.56 down from $4.64 one month ago [MarketWatch/Yahoo T3/T4, Oct 11-13 2026]
- Management pre-announcement (mid-Sept): IB fees ~-10% YoY, trading ~flat, FY26 NII growth toward upper end of 6-8% [T3/T4]
- Fed hiked to 3.75-4.00% in Sept 2026; curve steepened (10Y ~5.21%); S&P projects BAC Q3 NII +7.7% YoY [macro research]
- Peer prints Oct 13: JPM raised 2026 NII guidance to $106.2B; Citi NII +13.7% YoY; GS IB fees +21%; WFC NII slightly missed, provisions below consensus [CNBC T3/Reuters T2]
- Credit spreads Sept-Oct: AAA unchanged, AA/A/BBB widened modestly, CCC +135bp — a rates shock, not a broad credit break [macro research T4]
- BAC has beaten EPS consensus five consecutive quarters [T4 — no T1/T2 confirmation]
- Analyst target cuts (GS $76→66, Jefferies $75→70, JPM $68→62) with ratings still positive [T4 only, unconfirmed by higher-tier sources]
Catalysts and risks
Catalysts
- Q3 2026 earnings release Oct 14, 2026, 6:45am ET; call 8:30am ET — NII guide language is the event
- Updated FY26 NII guidance and any 2027 NII/deposit-beta framework
- Capital return announcements (buyback pace, CET1 commentary)
- FOMC December 2026 decision — one more hike is embedded in BAC's NII guide; a hawkish surprise helps NII but pressures multiples, a dovish pivot hurts both
- Trend in long-end yields and lower-rated credit spreads (CCC +135bp in Sept-Oct)
Risks
- Deposit beta rising faster than expected, capping NIM expansion
- Credit deterioration in card/commercial portfolios with restrictive policy
- Sustained high long-end yields pressuring the bond portfolio and the multiple
- Capital-markets underperformance vs peers persisting
- BAC trades as a JPM proxy (0.80 correlation) — sector selloffs swamp stock-specific upside
What to watch
- FY26 NII guidance language on Oct 14: raised above 8% vs held — the single deciding variable
- Deposit costs and deposit-beta commentary for 2027
- IB fees vs the pre-announced -10% and trading vs flat
- Provision expense and card NCOs vs WFC's below-consensus print
- CET1 ratio and buyback pace
- Whether the stock holds its post-print level if FY27 EPS estimates stay ~$5.21 — that distinguishes multiple compression from deterioration
Market snapshot when the call was made 2026-10-12
Price
| Return 1w | +1.1% |
| Return 1m | -12.9% |
| Return 3m | -10.0% |
| Return 6m | +2.8% |
| Return 1y | +11.4% |
| From 52-week high | -15.8% |
| Realized vol, 20d | 19.1% |
| SPY 3m / 1y | +3.5% / +15.9% |
| QQQ 3m / 1y | +3.7% / +22.2% |
Technicals
BAC technicals as of 2026-10-12: last close $54.58; 20d SMA 55.63 (bearish); 50d SMA 59.92; 12d EMA 54.77; 26d EMA 56.53; RSI 14 36.2 (balanced); 20d vol 18.9%; volume x0.6 vs 20d avg
Verifier notes REVISE · opinion revised once
Unsupported claims
- Q3 revenue expected '~9% YoY': the evidence bundle contains two conflicting figures — search_company_research says consensus revenue would be ~9% above the year-earlier quarter, but get_earnings_context states the consensus called for roughly 4.7% YoY revenue growth in Q3 (vs 9.8% in the prior-year quarter). The opinion presents ~9% as settled fact in direct_answer, market_expectation, and thesis without acknowledging the conflict.
- 'BAC is the most asset-sensitive money-center bank' / 'the most asset-sensitive large bank': the evidence says BAC has 'substantial sensitivity' to rates and that asset-sensitive banks benefit, and that S&P projects BAC Q3 NII +7.7% — but no source ranks BAC as the *most* asset-sensitive large bank. This superlative underpins the thesis and why_this_matters.
Weakly sourced
- The ~9% Q3 revenue growth figure rests on T3/T4 sources and contradicts another T4 figure (4.7%) in the same bundle.
- 'IG spreads flat' (why_market_may_be_wrong): the macro evidence says AAA spreads were unchanged but AA, A, and BBB widened modestly — 'flat' overstates the evidence, though the digest also used this phrasing.
Corrections applied
- In direct_answer and market_expectation, state the Q3 revenue growth expectation as a range or flag the source conflict (evidence shows estimates of ~4.7% to ~9% YoY depending on source, vs 9.8% in the prior-year quarter) rather than asserting ~9%.
- Soften 'most asset-sensitive large/money-center bank' to 'among the most asset-sensitive large banks' or 'highly asset-sensitive', or add evidence supporting the superlative.
- Qualify 'IG spreads flat' as 'AAA spreads unchanged, other IG spreads widened only modestly' to match the macro evidence.
Sources (24 · T1 = primary filings)
- T3https://www.spglobal.com/market-intelligence/en/news-insights/research/2026/10/visible-alpha-breakdown-of-us-b…
- T3https://www.morningstar.com/stocks/4-things-watch-big-bank-earnings
- T4https://www.ssga.com/hk/en/institutional/insights/monthly-cash-review
- T4https://www.theasianbanker.com/updates-and-articles/federal-reserve-adopts-stress-test-changes-to-reduce-volat…
- T4https://www.bbvaresearch.com/wp-content/uploads/2026/10/US_Interest_Rates_Monitor_October_26_ENG.pdf
- T4https://www.ssga.com/lu/en_gb/institutional/insights/monthly-cash-review
- T4https://www.ecb.europa.eu/press/pr/date/2026/html/ecb.pr261007~6447350434.en.html
- T4https://www.rexshares.com/macro-monthly-october-2026-us-treasury-yield-assessment-and-top-10-factors/
- T4https://www.marketbeat.com/earnings/reports/2026-10-14-bank-of-america-co-stock/
- T4https://www.spreadex.com/financials/news-analysis/financial-trading-blog/12-10-2026-2/
- T4https://www.asktraders.com/analysis/bank-of-america-q3-earnings-preview-heres-what-to-expect-on-14-october/
- T4https://www.gomarkets.com/en-au/articles/trading-us-bank-earnings-q3-scenarios-for-jpm-gs-and-bac
- T4https://www.perplexity.ai/finance/BAC?comparing=BAC,WFC,SAN,HSBC,IBN,C
- T4https://www.perplexity.ai/finance/BAC?comparing=BAC,BCS,BNDSF,WFC,HSBC,SAN
- T4https://www.perplexity.ai/finance/BAC-PQ/earnings
- T4https://www.tradingview.com/news/seekingalpha:d52a1a04e094b:0-earnings-week-ahead-jpm-jnj-bac-gs-c-unh-tsm-and…
- T3https://www.cnbc.com/2026/10/13/bank-earnings-live-updates.html
- T4https://www.investors.com/news/jpmorgan-chase-goldman-sachs-earnings-wells-fargo-citigroup/
- T4https://finance.yahoo.com/markets/stocks/articles/bank-americas-stock-buy-ahead-205002342.html
- T4https://www.forbes.com/sites/mayrarodriguezvalladares/2026/10/13/big-bank-third-quarter-earnings-lenders-stead…
- T4https://www.investing.com/analysis/bank-earnings-q3-2026-goldman-30-beat-jpmorgan-misses-revenue-200689491
- T2http://rmb.reuters.com/rmd/rss/item/tag:reuters.com,2026:newsml_KBN3VO10I?channel=FBi345
- T4https://www.rttnews.com/list/earnings.aspx
- T4https://247wallst.com/cards/q3-earnings-season-front-loads-everything-into-two-mornings-unh-earnings-calendar-…
Want a fresh look at BAC, or another name?
Queue a new deep-research run. Published to the feed when done.
Automated research opinion, published as-is on Oct 13, 2026. Not personalised advice. Figures use end-of-day closes.