Value trap — for now.
Thesis
Bull case
North America grew +2% with wholesale stabilizing and running growing double-digits for five straight quarters (~+$1B) — the core franchise is healing where it matters most. Tariff relief is a genuine recurring margin tailwind plus refund cash with interest. A ~4.5% dividend yield, $9B cash, and the world's #1 athletic brand provide a floor; if China merely stops deteriorating, the FY28 recovery consensus ($2.40 EPS) makes $35 look like 14.5x FY28 — clearly cheap. Sentiment and positioning are already washed out.
Bear case
The turnaround timeline keeps extending: FY27 guided to shrink high-single-digits, China -26% with no bottom, Direct/Digital in freefall, $1B more restructuring through FY2031, and estimates still being cut. Clean earnings are ~$1.58, so the stock is ~22x clean trailing for negative growth — not distressed. Share loss to On/Hoka/Adidas/Anta is structural, the dividend consumes ~90% of FY27 consensus EPS leaving no buyback support, and FY28's assumed 9.5% growth rebound is the most fragile number in the model. Technicals show a slow bleed, not capitulation — no contrarian entry signal.
What would change our mind
- FY27 EPS consensus stabilizes or turns positive for 2+ consecutive months
- Greater China decline narrows to low-single-digits or better in Q2/Q3 FY27
- Wholesale order book inflects positive with improving full-price realization
- If the stock falls toward high-20s while estimates hold ~$1.80, the risk/reward flips and this bearish-lean thesis weakens
- Inventory begins declining meaningfully while gross margin (ex-refund) expands
Since publication vs SPY · closed horizons are frozen
The full research everything the view rests on
Direct answer to the question asked
Where the edge would come from
What the price assumes
At ~20x forward on $1.80 FY27 EPS, the market prices in continued revenue decline in FY27 but a return to ~9.5% revenue growth and ~33% EPS growth in FY28 — i.e., that FY27 is the trough. The current price does not assume a turnaround success; it assumes the bleeding stops by FY28.
Why the market may be wrong
Consensus FY28 growth of 9.5% looks heroic given China has shown no bottom, share loss is structural (Nike's global footwear share fell ~3pp to 22.9% in 2025, third consecutive decline), and Nike is over-indexed to lifestyle footwear, the shrinking segment. If China deterioration forces another guidance cut at the December or March earnings, the FY28 recovery narrative collapses and a 'cheap' stock de-rates further. Conversely, the market may be underpricing the tariff-refund cash tailwind and the NA wholesale inflection if China merely stabilizes.
The one thing to watch
The variable to watch is not revenue or China — it's clean EPS: headline FY26 EPS of $2.10 contains a ~$0.52 one-time tariff refund, so every 'NKE is cheap vs. history' argument using trailing earnings is off by ~30%; on ~$1.58 underlying EPS the stock is ~22x trailing for a company guiding to shrink high-single-digits, which means the current price already embeds the FY28 recovery the data doesn't yet support.
Key evidence (8)
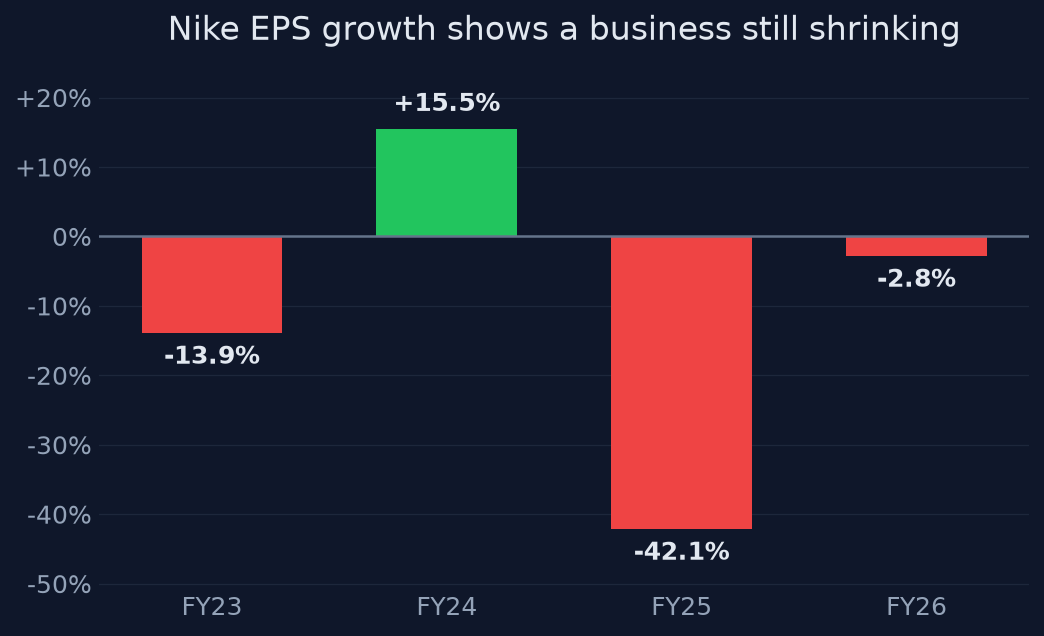
- FY revenue $51.4B (FY24) → $46.3B (FY25) → $46.4B (FY26); diluted EPS $3.73 → $2.16 → $2.10 [SEC 10-K, T1]
- Q4 FY26 EPS $0.72 included $0.52 one-time IEEPA tariff-recovery benefit; gross margin 49.2% included ~900bp refund benefit [Q4 FY26 release, T1]
- Q1 FY27 (reported 10/1/26): revenue $11.2B, -4% reported/-5% cN, missed $11.32B consensus; Greater China -26% cN; EMEA -5%; Digital -13%; NA +2% [company release/Reuters, T2/T4]
- FY27 guidance: high-single-digit revenue decline vs. consensus near flat; new 'Pace' restructuring up to $1B pretax charges through FY2031 [Q1 FY27 release/transcript]
- FY27 EPS consensus cut ~$2.00 → $1.80 (one series to $1.61 post-earnings); FY28 cut $2.70 → $2.40 [consensus aggregators, T3/T4]
- FY26 operating cash flow only $2.87B including ~$0.3B non-recurring tariff recoveries; cash ~$9.0B; inventory $7.5B flat YoY [10-K, T1]
- Nike global athletic-footwear share fell ~3pp to 22.9% in 2025, third consecutive annual decline; Adidas rose to ~12.2%; On guiding low-20% cN growth at 65% gross margin [Euromonitor-cited reporting, T2]
- Stock -45.8% over 1y, -49% below 52w high; 20d realized vol at 9th percentile, RSI 43, volume 0.6x average — slow bleed, no capitulation [market data, 2026-10-13]
Catalysts and risks
Catalysts
- Q2 FY27 earnings (~late December 2026): China trajectory and any FY27 guidance revision
- Q3 FY27 earnings (~March 2027): first evidence for/against FY28 recovery consensus
- Wholesale order book / futures commentary and full-price sell-through data
- China stimulus or consumer data affecting Greater China demand
- Tariff refund cash receipts and final resolution of liquidated-entry appeals
- Potential further estimate revisions on FY28 $2.40 consensus
Risks
- China continues deteriorating beyond -26%, forcing another guidance cut
- FY28 recovery consensus proves optimistic, triggering further de-rating
- Estimate cuts continue — falling forward EPS mechanically raises the effective multiple
- Dividend sustainability questions if FCF stays ~$3B while payout is ~90%
- Competitive share loss accelerates in running, Nike's one improving category
- Dead-money risk: slow bleed without capitulation can persist for quarters
What to watch
- Clean (ex-tariff-refund) EPS trajectory, not headline
- FY27/FY28 consensus revision direction week over week
- Greater China currency-neutral growth each quarter
- Nike Direct/Digital trends vs. wholesale divergence
- Operating cash flow and free-cash-flow coverage of the dividend
- Volume/capitulation signature: a high-volume washout would mark a better entry than the current low-volatility bleed
Market snapshot when the call was made 2026-10-13
Price
| Return 1w | +2.1% |
| Return 1m | -4.6% |
| Return 3m | -17.4% |
| Return 6m | -20.1% |
| Return 1y | -45.8% |
| From 52-week high | -49.3% |
| Realized vol, 20d | 23.8% |
| SPY 3m / 1y | +3.1% / +19.1% |
| QQQ 3m / 1y | +3.6% / +26.1% |
Technicals
NKE technicals as of 2026-10-13: last close $35.33; 20d SMA 35.37 (bearish); 50d SMA 37.87; 12d EMA 35.12; 26d EMA 35.97; RSI 14 43.5 (balanced); 20d vol 23.3%; volume x0.6 vs 20d avg
Sources (31 · T1 = primary filings)
- T4https://investors.on-running.com/news/news-details/2026/On-Reports-Results-for-the-Second-Quarter-and-Six-Mont…
- T4https://logos-pres.md/en/news/nike-loses-market-share-and-competitors-gain-ground/
- T2https://www.reuters.com/business/retail-consumer/nike-stumbles-china-woes-cautious-outlook-temper-turnaround-h…
- T2https://www.reuters.com/company/adidas-ag/
- T4https://www.lek.com/sites/default/files/insights/pdf-attachments/2026-footwear-apparel-accessories-brand-heat-…
- T4https://europeanbusinessmagazine.com/billion-dollar-trainer-war/
- T4https://startupbootedfinancial.com/nike-competitors/
- T4https://uk.investing.com/news/transcripts/earnings-call-transcript-on-holding-shares-sink-19-after-strong-q2-2…
- T4https://about.nike.com/en/newsroom/releases/nike-inc-reports-fiscal-2027-first-quarter-results
- T4https://investors.nike.com/financial-information/financial-results/transcript/9591/q1-2027-transcript
- T4https://investors.nike.com/investors/news-events-and-reports/investor-news/investor-news-details/2026/NIKE-Inc…
- T4https://investors.nikeinc.com/investors/news-events-and-reports/investor-news/investor-news-details/2026/NIKE-…
- T4https://investors.nike.com/investors/news-events-and-reports/investor-news-details/2026/NIKE-Inc--Announces-Fi…
- T4https://investors.nike.com/investors/
- T4https://investors.nikeinc.com/rss/pressrelease.aspx
- T4https://investors.nike.com/Search-Results/default.aspx?SearchTerm=&PageNumber=300
- T2https://www.reuters.com/legal/legalindustry/how-get-your-ieepa-tariff-refunds--pracin-2026-04-22/
- T4https://www.troutman.com/insights/getting-duties-back-where-recovery-stands-under-ieepa-section-122-and-sectio…
- T4https://www.pwc.com/us/en/services/tax/library/pwc-cit-issues-order-related-to-ieepa-duty-refunds.html
- T4https://www.skadden.com/insights/publications/2026/04/insights-april-2026/tariff-refund-mechanism-takes-shape
- T4https://kpmg.com/us/en/frv/reference-library/2026/tariffs-financial-reporting.html
- T4https://www.pwc.com/ca/en/services/tax/publications/tax-insights/us-court-ieepa-tariff-refunds-2026.html
- T4https://www.bdo.global/en-gb/insights/tax/indirect-tax/united-states-supreme-court-reins-in-ieepa-tariff-autho…
- T4https://www.pwc.com.au/tax/tax-alerts/ieepa-tariffs.html
- T4https://about.nike.com/en/newsroom/releases/nike-inc-reports-fiscal-2026-fourth-quarter-and-full-year-results
- T1https://www.sec.gov/Archives/edgar/data/320187/000032018726000026/q3fy26exhibit991er.htm
- T1https://www.sec.gov/Archives/edgar/data/320187/000032018726000088/nke-20260531.htm
- T2https://www.reuters.com/business/retail-consumer/nike-quarterly-sales-miss-estimates-china-weakness-competitio…
- T2https://www.reuters.com/legal/transactional/nike-edges-past-quarterly-revenue-estimates-2026-06-30/
- T4https://investors.nike.com/investors/news-events-and-reports/investor-news/investor-news-details/2026/NIKE-Inc…
- T1https://www.sec.gov/Archives/edgar/data/320187/000032018725000138/q2fy26exhibit991er.htm
Earlier and later calls on NKE
- Sep 29, 2026No — not yet, and earnings is the test.No clear edgeview changed
Want a fresh look at NKE, or another name?
Queue a new deep-research run. Published to the feed when done.
Automated research opinion, published as-is on Oct 14, 2026. Not personalised advice. Figures use end-of-day closes.