Mostly yes — it's a re-rating, not an inflection.
Thesis
Bull case
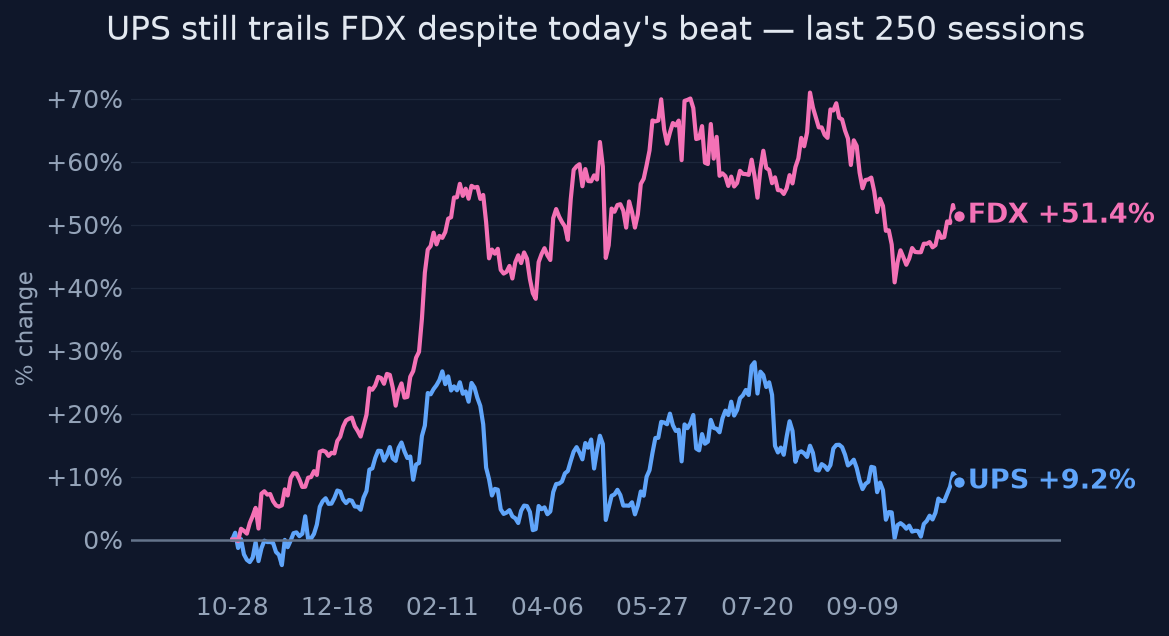
The self-help story is working and the market is under-crediting it. Q3 proved UPS can grow revenue 6.7% and expand domestic margins 60bps while deliberately shrinking volume — the durable half of yield gains (base rates, mix) recurs annually, $3B of cost savings is on track, and the Amazon drag is now lapped. Guidance was raised into peak season against a backdrop of downward revisions, forcing upgrades. At 12.9x forward earnings with a ~5%+ dividend yield and a stock still 15% below its high while FDX trades on a re-rated multiple after +59%, even 'meets plan' in Q4 likely means multiple expansion toward peers.
Bear case
The beat is lower quality than the headline. Adjusted EPS fell YoY, the guidance raise was only +0.8%, roughly half the international yield gain was fuel surcharges, and management itself says mix benefits normalize as the Amazon glide-down completes — the easiest margin improvement is behind. Q4 ADV is guided down 1.3% with peak surge dependent on ~100 large customers (~80% of the surge) on a network that has just closed facilities and cut jobs. Dividend coverage at ~1.13x adjusted FCF leaves almost no cushion if peak disappoints, and 'adjusted' FCF has not been reconciled to reported cash flow. EPS has fallen every year since 2021 and nothing in this print reverses that.
What would change our mind
- U.S. Domestic adjusted operating margin flat-to-down YoY in Q4 despite the guided $3.3B operating profit — would signal the margin gains were fuel/mix timing, not structural
- FY26 adjusted FCF guidance cut below ~$5.7B, or the 10-K shows reported cash flow materially below the adjusted figure — dividend coverage thesis breaks
- Q4 revenue materially below the ~$25.7B guide or ADV decline significantly worse than -1.3% YoY — pricing power insufficient to offset volume loss
- Management signals Amazon mix benefits ending faster than replacement volume arrives in 2027
Since publication vs SPY · closed horizons are frozen
The full research everything the view rests on
Direct answer to the question asked
Where the edge would come from
What the price assumes
At ~12.9x forward earnings and 14.8% below the 52-week high, the price assumes modest FY26 delivery (~$7.28 adjusted EPS) but does not price a return to volume growth or historical mid-teens operating margins. Consensus had been revised down over the prior three months (BofA cut targets on Amazon volume loss), so the bar into Q4 was low; the +3.6% move largely re-rates those lowered expectations rather than embedding new optimism.
Why the market may be wrong
Either direction is possible. Bears may be wrong because the durable half of the yield story (base rates + customer mix, explicitly ~half of the 6.1% U.S. revenue-per-piece gain) is recurring, and the network is now sized for profitability rather than volume — FDX got a 59% one-year re-rating for a similar playbook. Bulls may be wrong because roughly half the international revenue-per-piece gain was fuel surcharges, management admits Amazon mix benefits normalize as the glide-down ends, and Q4 ADV is guided down 1.3% YoY on a shrunken network heading into its first post-Amazon peak season.
The one thing to watch
The variable to watch is not EPS or even revenue — it is U.S. Domestic adjusted operating margin, because it is the only number that separates the durable thesis (cost cuts + pricing discipline surviving the Amazon exit) from the transient one (fuel surcharges and mix timing flattering a still-shrinking business). This quarter it rose 60bps YoY to 7.0%; if the Q4 print — implied by the $3.3B adjusted operating profit guide on lower volumes — holds or extends that gain, the structural story is real and the stock deserves a multiple closer to FDX's; if it stalls, the beat was cosmetic.
Key evidence (9)
- Q3 2026 (reported 10/27/26): revenue $22.9B vs ~$22.29B expected, +6.7% YoY; adjusted EPS $1.69 vs $1.63 expected but down from $1.74 a year ago (UPS IR release; CNBC [T3]; Reuters [T2])
- FY26 guidance raised modestly: revenue ~$92.6B (from ~$91.2B), adjusted EPS ~$7.28 (from ~$7.22, +0.8%), adjusted FCF ~$6.1B; Q4 guided to ~$25.7B revenue / ~$3.3B adjusted operating profit (UPS release [T4-company], Reuters [T2])
- U.S. Domestic adjusted operating margin 7.0% vs 6.4% a year ago; International 14.9% vs 14.8% (UPS release via Reuters [T2])
- Revenue growth is price/mix, not volume: U.S. ADV -3.3%, International ADV -8.7%, while U.S. revenue per piece +6.1% (~half base rates/mix) and International +15% (~half fuel surcharges) (CNBC [T3], earnings call transcripts [T4])
- Dividend coverage is thin: ~$6.1B adjusted FCF vs ~$5.4B dividends ≈ 1.13x, before $3B capex and $1.3B pension contributions; YTD FCF $4.2B vs $4.1B dividends paid (UPS release [T4-company])
- Estimates had been revised down over the prior three months; BofA cut targets citing Amazon volume declines; post-print analyst tone constructive (Jefferies 'strong execution', Evercore on earnings durability) (research summary [T3/T4])
- Valuation: forward P/E ~12.9x vs trailing ~18.7x (StockAnalysis [T4]); stock 14.8% below 52-week high, +21% 1y vs FDX +59% (computed price history)
- Multi-year SEC fundamentals: revenue down from $100.3B (2022) to $88.7B (2025); diluted EPS down from $13.20 to $6.56; operating margin from 13.0% to 8.9% (SEC XBRL [T1])
- Quant context: 20d realized vol at 0th percentile of past year (unusually quiet), RSI 77.5 overbought, 97% idiosyncratic vs SPY — today's move is company-specific repricing, not beta (computed daily price history)
Catalysts and risks
Catalysts
- Q4 2026 earnings (late January 2027): the real test — implied $3.3B adjusted operating profit on lower volumes
- Peak season execution data: weekly shipping volumes, on-time performance, and any shipper commentary through December
- Analyst estimate revisions over the next 2-4 weeks — whether FY27 consensus builds on the $7.28 base or assumes margin give-back
- Reconciliation of adjusted FCF ($6.1B) to GAAP operating cash flow in the 10-K
- Any update on 2027 cost-savings targets and post-Amazon replacement volume (healthcare, SMB)
Risks
- Peak season miss: first holiday on a shrunken network, with surge volume concentrated in ~100 customers
- Yield gains prove transient: fuel surcharges reverse with fuel prices; mix benefit normalizes per management's own admission
- Dividend stress: 1.13x adjusted FCF coverage leaves no room for a weak Q4, higher pension funding, or working-capital swing
- Volume declines eventually overwhelm pricing power and erode network density/fixed-cost absorption
- RSI 77.5 and 0th-percentile realized vol suggest near-term pullback risk after the pop
What to watch
- U.S. Domestic adjusted operating margin in the Q4 print (vs 7.0% this quarter) — the single thesis-defining number
- Weekly peak-season volume data and any large-shipper commentary in November-December
- Revenue per piece composition: base-rate/mix component vs fuel surcharge component
- FY27 consensus EPS formation — does the market extrapolate margin gains or assume normalization
- Adjusted FCF-to-dividend coverage reconciliation when the 10-K files
- FDX relative multiple — whether the market starts pricing UPS on the same self-help framework
Market snapshot when the call was made 2026-10-26
Price
| Return 1w | +2.9% |
| Return 1m | +6.8% |
| Return 3m | -4.9% |
| Return 6m | -5.8% |
| Return 1y | +20.9% |
| From 52-week high | -14.8% |
| Realized vol, 20d | 15.4% |
| SPY 3m / 1y | +3.3% / +13.9% |
| QQQ 3m / 1y | +5.4% / +16.6% |
Technicals
UPS technicals as of 2026-10-26: last close $100.32; 20d SMA 96.06 (bearish); 50d SMA 98.85; 12d EMA 98.39; 26d EMA 97.75; RSI 14 77.5 (overbought); 20d vol 15.3%; volume x1.4 vs 20d avg
Sources (13 · T1 = primary filings)
- T4https://about.ups.com/us/en/newsroom/press-releases/financials/ups-releases-3q-2026-earnings.html
- T3https://www.cnbc.com/2026/10/27/ups-ups-q3-2026-earnings.html?ref=bullished.co
- T2https://www.reuters.com/business/retail-consumer/ups-raises-annual-profit-revenue-forecasts-higher-paying-ship…
- T4https://uk.investing.com/news/stock-market-news/earnings-call-transcript-ups-beats-q3-2026-estimates-and-lifts…
- T4https://www.clarin.com/us-news/why-ups-stock-is-climbing-today-q3-profit-tops-estimates-full-year-revenue-outl…
- T4https://www.investing.com/news/transcripts/earnings-call-transcript-ups-beats-q3-2026-estimates-and-lifts-outl…
- T4https://ca.investing.com/news/stock-market-news/earnings-call-transcript-ups-beats-q3-2026-estimates-and-lifts…
- T4https://www.roic.ai/quote/UPS/transcripts
- T3https://www.cnbc.com/2026/10/27/ups-ups-q3-2026-earnings.html
- T4https://finance.yahoo.com/markets/stocks/articles/ups-ups-reports-q3-earnings-123005866.html
- T4https://www.marketbeat.com/earnings/reports/2026-10-27-united-parcel-service-inc-stock/
- T4https://www.stocktitan.net/articles/ups-q3-2026-earnings-fewer-packages-higher-price-per-package
- T4https://247wallst.com/companies/ups/earnings/
Want a fresh look at UPS, or another name?
Queue a new deep-research run. Published to the feed when done.
Automated research opinion, published as-is on Oct 27, 2026. Not personalised advice. Figures use end-of-day closes.