Half right — relief, not recovery.
Thesis
Bull case
Expectations and valuation are washed out (4.7x forward earnings, ~2% above 52-week low before the print). Revenue beat, AOI turned positive with NA margins +340bps, the €6bn efficiency program is landing on schedule, guidance was reaffirmed rather than cut, and liquidity of €42.7bn funds the transition. If Q4 shows FCF inflecting and 2027 consensus EPS (~$1.63) holds, the stock is pricing a fraction of normalized earnings — the re-rating asymmetry is substantial.
Bear case
The 'beat' is cosmetic: EPS missed, industrial FCF of -€4.0bn missed expectations, the company is still loss-making, and the headline loss improvement is a base-effect artifact. 9M FCF of -€4.9bn makes the FY26 'improvement' language dependent on an implausible Q4 swing; US destocking and product-reinvestment needs could keep cash burn elevated into 2027; Europe margins are still deteriorating (-340bps) and EU CO2/tariff headwinds (~€1.0-1.2bn net tariff hit guided) persist. A 15.6% pop on this mix is short-covering, not new information.
What would change our mind
- Bearish invalidation (turns bullish): Q4 2026 industrial FCF prints near or above breakeven, or analysts revise 2027 EPS up post-print while the stock holds gains
- Bullish invalidation (turns bearish): management qualifies or pushes out the 2027 positive-FCF commitment, or Q4 FCF is materially negative again without a working-capital/one-off explanation
- Either way: a cut to FY26 guidance language at the next update voids the stabilization narrative
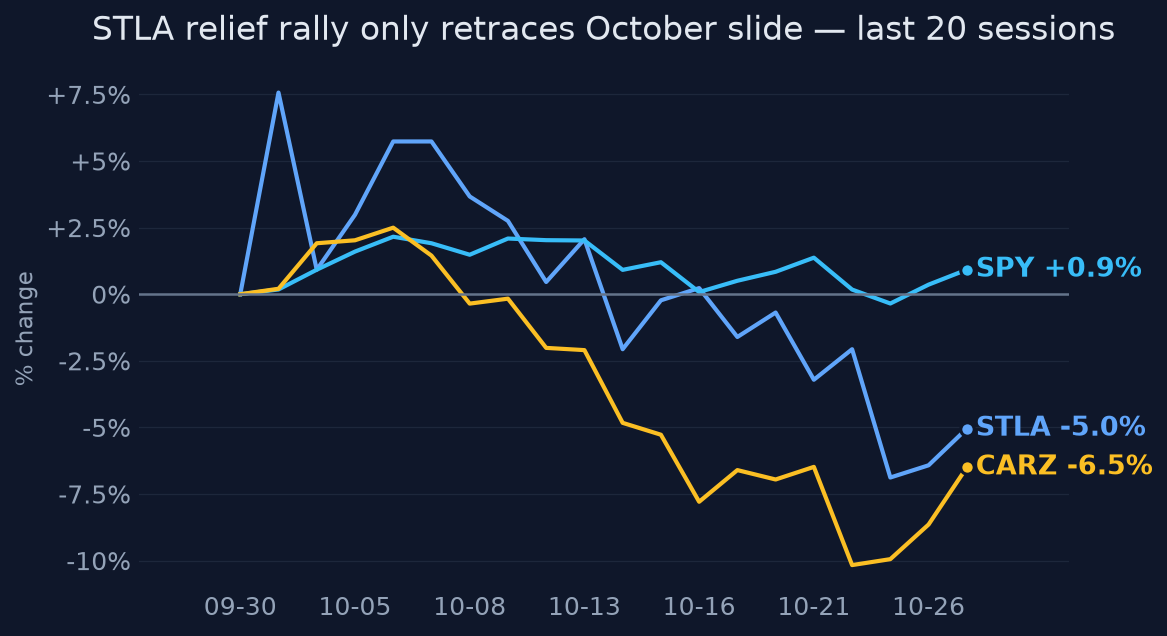
Since publication vs SPY · closed horizons are frozen
No price data after the entry date yet.
The full research everything the view rests on
Direct answer to the question asked
Where the edge would come from
What the price assumes
At ~$4.79 and ~4.6-4.7x forward P/E with a ~$14bn market cap, the market prices Stellantis as a structurally impaired automaker; post-print it is pricing a modestly higher probability that Filosa's turnaround succeeds, but consensus estimates (2026 EPS ~$0.89, 2027 ~$1.63 per T4 aggregator data) have not yet visibly revised.
Why the market may be wrong
Both directions are plausible. Bulls: the market may be underpricing the speed of margin recovery — NA +340bps YoY and 40% of the €6bn efficiency program landing by year-end could make 2027 estimates conservative. Bears: the rally may be misreading a low-quality quarter — EPS missed, FCF missed, the '90% smaller loss' is flattered by prior-year one-offs, and at least one analyst (Reduce, €3.30 target) flags further US destocking and heavy product-reinvestment cash needs.
The one thing to watch
The 'earnings beat' framing is wrong — the quarter was a revenue beat with an EPS and cash-flow miss, and the variable that actually decides the thesis is the Q4 industrial FCF print: 9M 2026 FCF is ~-€4.9bn, so management's 'improved YoY' guidance and the 2027 positive-FCF pledge require a multi-billion-euro Q4 swing that Q3's -€4.0bn (worse than the ~-€3.4bn expected) does not yet support. Watch Q4 FCF decomposition (working capital vs. the €2bn legacy-charge payments vs. operating burn), not headline EPS.
Key evidence (7)
- Q3 2026 (Oct 28, 2026, Stellantis IR press release): revenue €37.6bn (+1% YoY) vs ~€36.4-36.9bn consensus; AOI ~€0.3bn (0.7% margin); net loss ~€0.45-0.5bn (~90% smaller YoY, flattered by prior-year one-offs); industrial FCF -€4.0bn, ~€0.3bn better YoY but worse than ~-€3.4bn expected
- Adjusted EPS ≈ -€0.01 vs +€0.097 consensus (Investing.com/market coverage — consensus from secondary sources, not a primary database)
- 9M 2026 industrial FCF ≈ -€4.9bn (Q1 -€1.9bn, Q2 +€1.0bn, Q3 -€4.0bn, per Q1/Q2/Q3 releases); FY26 guidance reaffirmed but qualitative: mid-single-digit revenue growth, low-single-digit AOI margin, FCF 'improved YoY' while absorbing ~€2bn of H2-2025 charge payments; positive industrial FCF pledged for 2027
- Pre-print price context (Oct 27 close $4.14): RSI 29.6, -10.4% 1m, ~2% above 52-week low, -25.5% below 52-week high — the +15.6% move largely recovers October's slide within a downtrend
- NA AOI margin +340bps YoY; Enlarged Europe -340bps; Value Creation Program on track for ≥40% of €6bn run-rate efficiencies by end-2026; liquidity ~€42.7bn (~26% of TTM revenue)
- At least one analyst retained Reduce with €3.30 target, citing further US destocking and product-reinvestment cash needs (Investing.com coverage)
- 88% of STLA variance vs SPY is idiosyncratic (correlation 0.35) — the move is purely company-specific
Catalysts and risks
Catalysts
- Q4 2026 results (~Feb 2027): the live test of the FCF trajectory and the 2027 positive-FCF pledge
- Post-print analyst estimate revisions over the next 1-4 weeks — whether the revenue/AOI beat flows into 2026-27 EPS upgrades
- Year-end confirmation of ≥40% of the €6bn efficiency target being implemented
- US inventory/destocking disclosures and tariff developments (~€1.0-1.2bn guided headwind)
- FaSTLAne 2030 execution milestones and any capital-markets updates
Risks
- Industrial FCF burn persists (Q3 -€4.0bn, worse than expected), forcing guidance language walk-backs
- Further US destocking and product-reinvestment cash needs beyond current guidance
- Enlarged Europe margin decline (-340bps) continues; EU CO2 compliance costs
- Tariff headwind (~€1.0-1.2bn) worsens
- Key consensus/EPS figures rest on T4 aggregators and market coverage, not primary consensus databases — treat precise beat/miss magnitudes with some caution
What to watch
- Q4 2026 industrial free cash flow and its decomposition (working capital vs. €2bn legacy-charge payments vs. operating burn) — the single number
- Analyst estimate revisions for 2026/2027 EPS in the weeks after the print
- US dealer inventory levels and any destocking commentary
- North America AOI margin trajectory (was +340bps YoY)
- Short interest and whether the stock holds above the pre-earnings ~$4.14 level
Market snapshot when the call was made 2026-10-27
Price
| Return 1w | -4.4% |
| Return 1m | -10.4% |
| From 52-week high | -25.5% |
| Realized vol, 20d | 48.6% |
| SPY 3m / 1y | +5.5% / +13.6% |
| QQQ 3m / 1y | +9.0% / +16.9% |
Technicals
STLA technicals as of 2026-10-27: last close $4.14; 20d SMA 4.37 (bearish); 50d SMA 4.82; 12d EMA 4.26; 26d EMA 4.46; RSI 14 29.6 (oversold); 20d vol 48.4%; volume x1.5 vs 20d avg
Sources (15 · T1 = primary filings)
- T4https://www.stellantis.com/en/news/press-releases/2026/october/third-quarter-2026-financial-results
- T4https://www.ansa.it/english/news/business/2026/10/28/stellantis-says-revenues-up-losses-down-in-third-quarter_…
- T4https://www.repubblica.it/en/economy/2026/10/28/news/stellantis_revenue_up_in_the_third_quarter_losses_are_fal…
- T4https://www.stocktitan.net/news/STLA/stellantis-reports-q3-2026-financial-ig7cjafge8or.html
- T4https://uk.finance.yahoo.com/news/stellantis-q3-adjusted-operating-income-074916309.html
- T4https://au.investing.com/news/stock-market-news/stellantis-q3-2026-slides-turnaround-gains-traction-amid-chall…
- T4https://ca.investing.com/news/stock-market-news/stellantis-q3-2026-slides-turnaround-gains-traction-amid-chall…
- T4https://www.stellantis.com/en/investors/reporting/quarterly-results-materials
- T4https://www.media.stellantis.com/uploads/em/news/en20260730stellantisq22026financialresults-6a6ade4f83b01.pdf
- T4https://www.media.stellantis.com/uk-en/corporate/press/stellantis-reports-q2-2026-financial-results
- T4https://www.stellantis.com/content/dam/stellantis-corporate/investors/events-and-presentations/other-documents…
- T4https://www.stellantis.com/content/dam/stellantis-corporate/news/press-releases/2026/july/30-07-2026/fr/FR-202…
- T4https://www.stellantis.com/content/dam/stellantis-corporate/news/press-releases/2026/july/30-07-2026/it/IT-202…
- T4https://www.media.stellantis.com/uk-en/corporate/press/stellantis-reports-q1-2026-financial-results-return-to-…
- T4https://www.stellantis.com/content/dam/stellantis-corporate/investors/events/stellantis-investor-day-2026/tran…
Want a fresh look at STLA, or another name?
Queue a new deep-research run. Published to the feed when done.
Automated research opinion, published as-is on Oct 28, 2026. Not personalised advice. Figures use end-of-day closes.