Priced-in fear, real fundamentals.
Thesis
Bull case
AWS acceleration (28%→36.7%) with 39% margins and pre-sold 2027-28 capacity means the capex wave is contracted revenue arriving late, not speculative build. NA retail margins expand through advertising and fulfillment leverage even while absorbing tariffs. The Anthropic stake is an underappreciated asset. If Q3 confirms AWS >33% growth and capex discipline signals, the stock re-rates toward the ~$321 consensus as the FCF trough narrative breaks — Google Cloud's margin trajectory is the proof-of-concept.
Bear case
FCF is already -$7.6B TTM and credible estimates point to -$50B/yr in 2027-28 as capex reaches $320-370B, with depreciation from this wave pressuring 2027-28 EPS (2027 consensus already below 2026). AWS is growing slower than Azure and Google Cloud, suggesting share loss in the exact AI workload cycle the capex is betting on. On normalized numbers (~32x 2026) the stock is not cheap, retail faces a strained consumer, and Anthropic gains mask the true earnings power.
What would change our mind
- Q3 AWS growth <30% or AWS operating margin compresses materially below ~35%
- 2027 capex guidance at or above ~$300B without commensurate backlog disclosure
- NA operating margin falls back below ~6% on tariff absorption
- Management walks back the '2027 capacity reserved' claim or backlog conversion disappoints
- Stock breaks below ~$235 post-earnings on guidance rather than multiple noise — an arbitrary technical level chosen as a ~10% de-rating trigger from current price, not tied to any evidence-based support (the actual 52-week low implied by the data is ~$199)
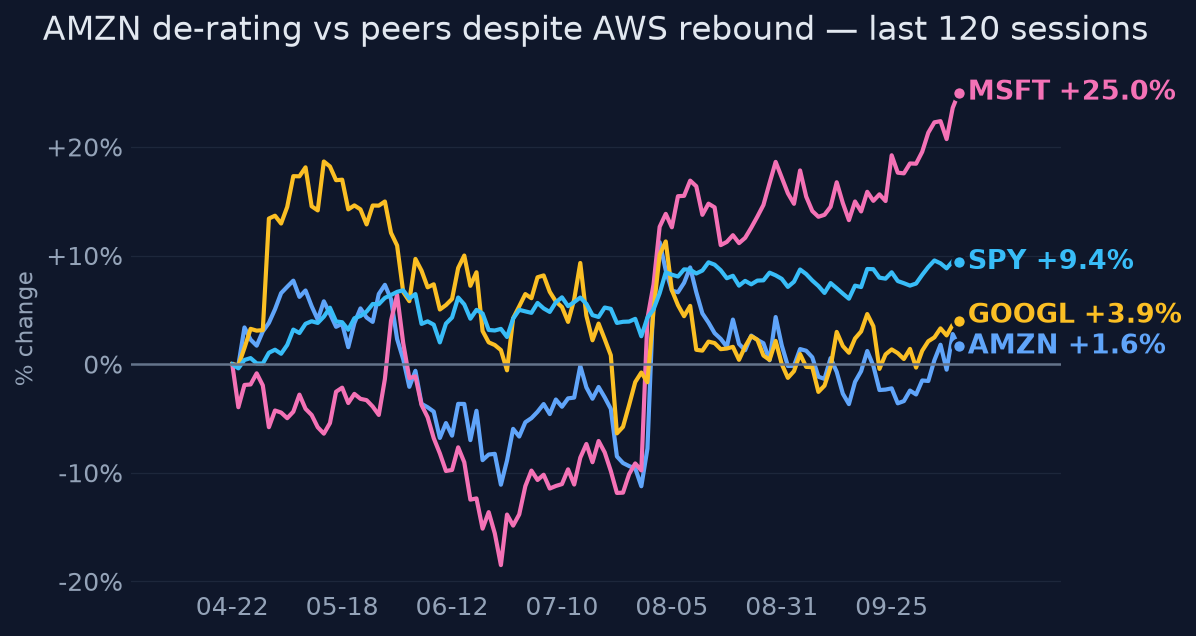
Since publication vs SPY · closed horizons are frozen
The full research everything the view rests on
Direct answer to the question asked
Where the edge would come from
What the price assumes
At ~$260 (8.6% below 52w high, +14% 1y vs MSFT +41% 6m), the market prices AMZN as the hyperscaler most exposed to AI capex indigestion: consensus ~$321 target implies ~24% upside but recent cuts (Cantor $320→$310, Wells $338→$329) show analysts trimming on FCF, not thesis. Embedded expectation: capex stays elevated, FCF stays negative through 2027, AWS growth doesn't outpace Azure/GCP.
Why the market may be wrong
The de-rating treats negative FCF as value destruction rather than prepaid capacity: management reports 2027 capacity largely reserved (some into 2028), which — if true [T4-sourced, unverified against filing] — means the revenue against this capex is substantially contracted. The market also applies the capex penalty against GAAP earnings inflated by Anthropic while failing to credit the Anthropic stake itself as an asset; both errors cut the same direction. Meanwhile Google Cloud's margin expansion ($2.8B→$8.8B op income) demonstrates AI demand does convert to returns, undercutting the 'capex never pays back' framing.
The one thing to watch
The variable to watch is not AWS growth or capex — it is whether Q3 GAAP 'other income' shrinks as Anthropic marks roll off, because the ~20x trailing P/E 'cheapest ever' narrative and the 2026 consensus of $12.89 are both artifacts of a one-time $53.4B mark; the real stock trades ~32x normalized 2026 EPS and ~25x 2027, so the post-earnings move will hinge on AWS margin and 2027 capex guidance, not headline EPS, and anyone anchored on the trailing multiple will misread the print.
Key evidence (8)
- Q2 2026 (reported Jul 2026): revenue $200.6B +20% y/y, operating income $27.5B +43%, AWS $42.2B +36.7% at ~39% op margin [T3 CNBC, T4 transcripts]
- TTM FCF -$7.6B vs +$18.2B a year earlier; Q2 capex $54.2B vs $32.1B; 2026 capex guide raised to ~$220B [T2 Reuters, T4]
- Q2 GAAP EPS $5.75 includes ~$53.4B pretax Anthropic gain; normalized Q2 EPS ≈ $1.85-1.90 (matches ~$1.84 pre-gain consensus) [T4; normalization is analytical estimate]
- Management: much of 2027 AWS capacity already reserved, some into 2028 [T4, unverified against 10-Q]
- AWS 36.7% vs Azure 43% and Google Cloud 82% growth; AMZN idiosyncratic variance 79% vs SPY — market is punishing AMZN specifically [T2/T3, computed]
- Evercore's Mahaney models 2027/28 capex ~$320B/$370B with ~-$50B FCF each year [T4 single source — flag as low-confidence]
- Q3 2026 guide $197-202B revenue; report confirmed Oct 29, 2026; 2027 consensus EPS $10.53 < 2026 $12.89 due to gain distortion [T4]
- NA op margin 7.9%, Intl 4.1%; ~$600M tariff refunds in Q2; tariffs mostly absorbed; holiday e-comm forecast +7.5-8.4% (Deloitte) [T3/T4]
Catalysts and risks
Catalysts
- Q3 2026 earnings Oct 29, 2026 — AWS growth, AWS margin, 2027 capex guidance, NA margin vs tariff costs
- Q4 2026 report (Feb 3, 2027) — holiday consumer read, first 2027 capex guidance
- Any disclosure quantifying AWS backlog/committed capacity or Anthropic stake valuation
- Hyperscaler capex commentary from MSFT/GOOGL prints (sector FCF sentiment spillover)
- Tariff policy changes and holiday retail data (Nov 2026-Jan 2027)
Risks
- 2027 capex guidance above ~$250B confirms the Evercore bear path and extends negative FCF
- AWS growth decelerates below ~30% while capex stays elevated — worst of both worlds
- Depreciation ramp compresses 2027 EPS below the already-lower $10.53 consensus
- Consumer credit strain (Bloomberg Oct 11, 2026) hits holiday discretionary spend
- Anthropic marks reverse, removing the GAAP earnings cushion and exposing the normalized multiple
- -21.7% max drawdown and 1.74 beta: high downside volatility if the print disappoints
What to watch
- Oct 29 print: AWS y/y growth and segment operating margin — the single deciding variable
- 2026/2027 capex language: any hint of peak or discipline vs open-ended commitment
- Other income line: Anthropic mark direction and size (headline EPS will mislead)
- NA op margin vs 7.9% and tariff pass-through language
- FCF trajectory and whether operating cash flow growth starts closing the capex gap
- MSFT/GOOGL cloud prints as sector sentiment and share-shift evidence
Market snapshot when the call was made 2026-10-12
Price
| Return 1w | +3.2% |
| Return 1m | +1.1% |
| Return 3m | +4.9% |
| Return 6m | +8.2% |
| Return 1y | +14.0% |
| From 52-week high | -8.6% |
| Realized vol, 20d | 25.3% |
| SPY 3m / 1y | +3.5% / +15.9% |
| QQQ 3m / 1y | +3.7% / +22.2% |
Technicals
AMZN technicals as of 2026-10-12: last close $259.53; 20d SMA 252.32 (bearish); 50d SMA 258.85; 12d EMA 255.17; 26d EMA 254.37; RSI 14 55.3 (balanced); 20d vol 24.0%; volume x0.7 vs 20d avg
Next earnings: 2027-02-03 AMC
Verifier notes REVISE · opinion revised once
Unsupported claims
- Invalidation condition 'Stock breaks below ~$235 (52w-low zone logic)': the evidence shows price is 30.55% above its 52-week low, implying a 52w low of ~$199 ($259.53 / 1.3055). $235 does not correspond to the 52-week low or any level in the evidence; it is an invented anchor mislabeled as '52w-low zone'.
Weakly sourced
- Evercore's 2027/28 capex of ~$320B/$370B with ~-$50B FCF per year is single-source [T4] and material to the bear case; the opinion does flag it as low-confidence, so this is acknowledged rather than a finding.
- The 'much of 2027 AWS capacity reserved, some into 2028' claim is [T4] transcript-sourced and load-bearing for the core thesis; the opinion appropriately marks it unverified, so this is disclosed rather than a violation.
Corrections applied
- Replace the '$235 (52w-low zone logic)' invalidation trigger with a level consistent with the evidence — either the actual 52-week low (~$199) or a clearly arbitrary technical level stated as such (e.g., 'breaks below ~$235, the post-drawdown support area'), without attributing it to the 52-week low.
Sources (31 · T1 = primary filings)
- T2https://www.reuters.com/business/ai-investment-boom-puts-big-techs-free-cash-flow-under-pressure-2026-07-22/
- T3https://www.cnbc.com/2026/07/30/aws-earnings-q2-2026.html
- T2https://www.reuters.com/business/retail-consumer/among-ai-crowd-some-investors-position-slower-hyperscaler-spe…
- T2https://www.reuters.com/commentary/reuters-open-interest/data-centre-reality-check-could-slam-brakes-ai-earnin…
- T3https://www.cnbc.com/2026/07/30/amazon-amzn-q2-earnings-report-2026.html
- T4https://www.aboutamazon.com/news/company-news/amazon-earnings-q2-2026-report
- T4https://finance.yahoo.com/markets/stocks/articles/amazon-q2-2026-earnings-aws-204411872.html
- T4https://tomtunguz.com/aws-answers-the-cloud-race/
- T4https://finance.yahoo.com/markets/stocks/articles/amazon-analysts-slash-price-targets-143855997.html
- T4https://www.marketbeat.com/stocks/NASDAQ/AMZN/news/
- T4https://stockanalysis.com/stocks/amzn/
- T4https://finance.yahoo.com/markets/stocks/article/amazon-stock-is-trading-at-its-lowest-valuation-ever-as-a-pub…
- T4https://www.perplexity.ai/finance/AMZN
- T4https://financefeeds.com/amazon-stock-price-prediction-340-bull-190-bear/
- T4https://www.perplexity.ai/finance/AMZN?comparing=AMZN,FOX,CMCSA,PSKY,IQ,META
- T4https://markets.businessinsider.com/news/stocks/amazon-com-price-target-lowered-to-310-from-320-at-cantor-fitz…
- T4https://247wallst.com/investing/2026/10/08/58-analysts-zero-sells-amazons-price-target-is-a-rare-consensus/
- T4https://opc.virtever.com/companies/AMZN/
- T4https://www.indmoney.com/blog/us-stocks/amazon-stock-price-prediction
- T4https://www.wallstreetzen.com/stocks/us/nasdaq/amzn
- T4https://finance.yahoo.com/markets/stocks/articles/amazon-amzn-good-ai-stock-143534466.html
- T4https://tickeron.com/earnings/AMZN/
- T4https://seekingalpha.com/symbol/AMZN/earnings
- T4https://www.nbcnews.com/business/consumer/holiday-season-spending-sentiment-rcna601167
- T4https://finance.yahoo.com/economy/articles/circana-2026-holiday-study-finds-200300800.html
- T4https://secure.earningswhispers.com/transcript/AMZN/Q22026
- T4https://earningscalls.dev/transcripts/amazon-com-inc_amzn_earnings_call_transcript_2026-07-30
- T2https://www.bloomberg.com/news/articles/2026-10-11/consumers-are-tapped-and-wall-street-fears-that-s-a-rally-k…
- T4https://tickertrends.io/transcripts/AMZN.NE/Q2-earnings-transcript-2026
- T4https://tickertrends.io/transcripts/AMZN/Q2-earnings-transcript-2026
- T4https://www.mckinsey.com/industries/consumer-packaged-goods/our-insights/the-state-of-the-us-consumer
Want a fresh look at AMZN, or another name?
Queue a new deep-research run. Published to the feed when done.
Automated research opinion, published as-is on Oct 13, 2026. Not personalised advice. Figures use end-of-day closes.