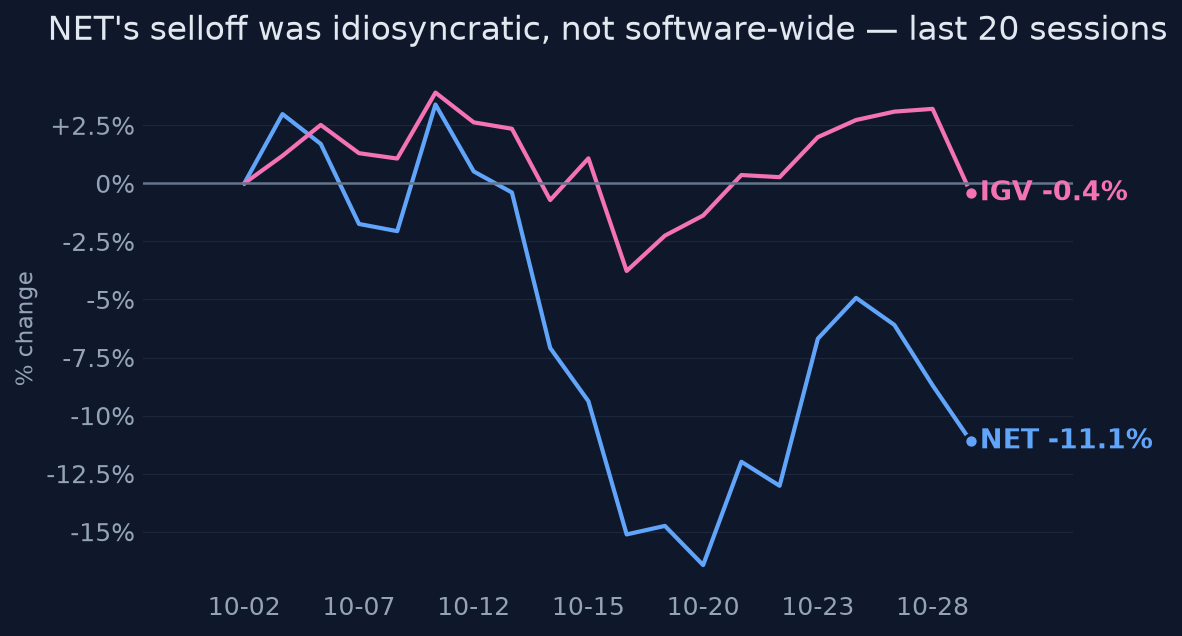
Not a fundamental break — a positioning unwind.
Thesis
Bull case
The selloff is pure multiple compression on positioning, not fundamentals — every operating metric from Q2 was accelerating (DBNR 120%, large-customer growth accelerating, revenue beat 4.7%, margin inflecting up). If Nov 5 shows growth holding ≥33% with gross margin ≥73.1%, the Oct 30 drop retraces quickly; the stock has already corrected 14% from highs with the guide likely sandbagged.
Bear case
At ~34x sales and ~200x forward earnings, NET prices flawless execution just as guidance implies deceleration (36%→31%), AI mix dilutes gross margin, GAAP operating margin is still ~-10%, and EPS revisions have been negative. A merely in-line $736M print with soft margins could trigger the real repricing — Oct 30 was the preview, not the event. Bernstein's $245 target already sits below the price.
What would change our mind
- If Nov 5 revenue comes in ≥$750M (~34%+ y/y) with gross margin ≥73.1% and FY guide raised, the 'positioning unwind, fundamentals intact' read is confirmed and the no-edge stance flips bullish
- If revenue is in-line but gross margin falls below 73% and DBNR drops below ~118%, the drop was correctly sniffing out mix deterioration — bearish confirmation
- If a company-specific disclosure surfaces (pre-announcement, large outage, security incident) that wasn't in the record, the 'no fundamental news' premise collapses
Since publication vs SPY · closed horizons are frozen
No price data after the entry date yet.
The full research everything the view rests on
Direct answer to the question asked
Where the edge would come from
What the price assumes
Post-drop (~$272-300), the market still prices a clean beat-and-raise: ~34x FY26E sales and ~200x forward EPS require sustained 30%+ growth with eventual margin leverage. Bernstein's Oct 29 target of $245 sits BELOW the post-drop price while Wells Fargo's is $400 — the 'consensus' is not a consensus.
Why the market may be wrong
Two-sided. Bears may be wrong because Q2 fundamentals were accelerating where it matters (DBNR 120%, $100k+ customers +27% and accelerating, first gross-margin uptick in 8 quarters) and nothing broke on Oct 30. Bulls may be wrong because guidance already implies deceleration (36%→31%), EPS revisions have been negative even as revenue revisions rose, and gross margin has eroded from 77.6% (2021) to 74.5% (2025) as lower-margin AI/developer workloads grow — the AI narrative is dilutive to the model so far.
The one thing to watch
The variable to watch is not the headline growth rate but the mix-adjusted one: Cloudflare's AI/developer workloads are growing fast AND diluting gross margin, so a Nov 5 revenue beat with gross margin below 73.1% would be a bearish print in bull's clothing — it confirms growth that the 200x multiple can't monetize. Watch gross margin vs 73.1% as the tiebreaker on any revenue surprise.
Key evidence (11)
- Q3 2026 earnings scheduled Nov 5, 2026 after close — Oct 30 was NOT an earnings reaction [T4 Cloudflare IR]
- No 8-K, profit warning, outage disclosure, or credible short report found around Oct 29-30; SEC page shows only routine 10b5-1 sales (CFO Seifert 12,500 sh, Oct 19) [T4]
- Oct 30 was a tech-led AI-spending de-risking session: Intel -25% on cash-burn warning; 10Y yield fell ~8bp to 4.91% — not a rates shock [T2 Reuters, 2026-10-30]
- Q2 2026 (Aug 6): revenue $696M, +~36% y/y, beat by 4.7%; EPS $0.29 vs $0.27 [T4]
- Q3 guide $736-737M implies ~31% y/y — guided deceleration vs Q2's 36% [T4]
- DBNR rose to 120%; $100k+ customers +27% (up from +25%) [T4]
- Forward P/E ~203x on Oct 29, top of its own October range (191-218x) [T4 chartloom — weak tier, treat as approximate]
- Gross margin trend: 77.6% (2021) → 74.5% (2025); Q2's 73.1% sequential uptick was first in 8 quarters [SEC XBRL]
- FY26 EPS consensus cut sharply in one GAAP series even as revenue consensus was raised to $2.87B [T4]
- Quant: 60d beta to SPY 2.78, 82% of variance idiosyncratic, +51% 6M, -14% below 52w high [computed from price history]
- Analyst split: Bernstein Market Perform, PT $181→$245 (Oct 29, below post-drop price); Wells Fargo PT $400; Zacks Strong Sell Oct 14 [T4]
Catalysts and risks
Catalysts
- Q3 2026 earnings Nov 5, 2026 after close — revenue vs $736-737M guide (~31% y/y)
- Gross margin print vs 73.1% Q2 level
- FY26 guidance update ($2.87B revenue / $1.25-1.26 EPS consensus)
- Post-print analyst revision direction: revenue vs EPS revisions diverging again would confirm the bear thesis
- Fed path after the Oct 29 hold (3.75-4.00%, two hawkish dissents)
Risks
- Binary earnings event Nov 5 — any position today is a coin-flip on the print
- Valuation (~200x fwd EPS) leaves no cushion for an in-line quarter
- AI-mix gross margin dilution is structural, not one-quarter
- Macro AI-capex sentiment remains fragile; another de-risking session hits NET hardest regardless of fundamentals
- Intraday price data on Oct 30 was inconsistent across sources; the -12.2% close is the authoritative read but path detail is murky
What to watch
- The ONE number: Q3 revenue y/y growth vs the ~31% implied by guidance (Q2 ran 36%)
- Tiebreaker: gross margin vs 73.1% — separates monetizable growth from dilutive AI-mix growth
- DBNR vs 120%
- Whether FY26 revenue consensus ($2.87B) is raised while EPS consensus is cut again
- High-multiple software tape into year-end: is the AI-returns de-risking a one-day event or a regime
Market snapshot when the call was made 2026-10-29
Price
| Return 1w | +2.2% |
| Return 1m | -10.7% |
| Return 3m | +11.2% |
| Return 6m | +51.4% |
| Return 1y | +38.5% |
| From 52-week high | -14.0% |
| Realized vol, 20d | 57.9% |
| SPY 3m / 1y | +3.0% / +12.0% |
| QQQ 3m / 1y | +4.0% / +13.0% |
Technicals
NET technicals as of 2026-10-29: last close $310.30; 20d SMA 327.97 (bullish); 50d SMA 320.69; 12d EMA 319.74; 26d EMA 323.60; RSI 14 32.0 (balanced); 20d vol 58.0%; volume x1.3 vs 20d avg
Sources (22 · T1 = primary filings)
- T4https://www.cloudflare.net/financials/sec-filings/default.aspx
- T4https://cloudflare.net/financials/sec-filings/
- T4https://finance.yahoo.com/quote/NET/
- T4https://cloudflare.net/news/news-details/2026/Cloudflare-Announces-Date-of-Third-Quarter-2026-Financial-Result…
- T4https://cloudflare.net/financials/sec-filings/sec-filings-details/default.aspx?FilingId=19288269
- T4https://www.marketbeat.com/instant-alerts/price-cloudflare-nyse-net-stock-crosses-below-50-day-moving-average-…
- T4https://www.perplexity.ai/finance/NET?comparing=NET,CGNX,TDC,MDB,PLTR,AMZN
- T4https://www.marketbeat.com/stocks/NYSE/NET/news/
- T4https://stockanalysis.com/stocks/net/transcripts/
- T4https://stockanalysis.com/stocks/net/transcripts/662709-q2-2026/
- T4https://www.cnn.com/markets/stocks/NET
- T4https://www.perplexity.ai/finance/NET?comparing=NET,MDB,ZS,WDAY,CRWD,SNOW
- T4https://simplywall.st/stocks/us/software/nyse-net/cloudflare
- T4https://www.stocktitan.net/sec-filings/NET/
- T2https://www.reuters.com/legal/transactional/global-markets-global-markets-2026-10-30/
- T4https://www.fidelity.com/news/article/us-markets/202610290043RTRSNEWSCOMBINED_L3N46F0DL_1
- T4https://finance.yahoo.com/economy/policy/live/fed-meeting-live-updates-federal-reserve-october-meeting-kevin-w…
- T3https://www.morningstar.com/news/dow-jones/202610292872/us-treasury-yields-fall-as-investors-digest-fed-meet-f…
- T3https://www.cnbc.com/2026/10/29/treasury-yields-federal-reserve-rates.html
- T4https://www.miamiherald.com/news/business/article317827289.html
- T4https://247wallst.com/cards/the-long-end-is-back-above-5-the-day-after-the-fed-s-decisi-macro-release-01m64yan…
- T4https://www.nwaonline.com/news/2026/oct/29/bond-market-swings-after-fed-says-no-rate-increase/
Want a fresh look at NET, or another name?
Queue a new deep-research run. Published to the feed when done.
Automated research opinion, published as-is on Oct 30, 2026. Not personalised advice. Figures use end-of-day closes.